


SIPMon for IP Contact Center
 SIPMon is a software solution that allows you to monitor all the infrastructures and applications of your information system / Data-Center. SIPMo’s technical and functional components offer you all the essential features for a comprehensive professional monitoring system. It meets the needs of the most demanding Information System Departments (ISD) / Data-Center (DC) while providing the flexibility linking.
The SIPMon for IP contact center & IT solution, monitors contact center services and underlying infrastructure components in contact centers in accordance with end-user’s service level agreements. Components monitored include Call Manager, Gateways and Gatekeepers, IP and ATA Phones, Routers and Switches, Servers, Firewalls, and more. All VoIP status data is analyzed and displayed in graphical alarm dashboards, performance reports, and SLA compliance reports.
Today’s successful contact center deployments require incessant network availability and 360 degree transparency of the infrastructure.
To achieve this requirement, it is crucial to proactively monitor end-to-end performance of all contact center & IT components for improved quality of service and problem diagnosis.
The SIPMon for Contact Center & IT solution. provides full VoIP & IT network infrastructure monitoring with emphasis on continuous SLA compliance and end-user satisfaction.
SIPMon is a software solution that allows you to monitor all the infrastructures and applications of your information system / Data-Center. SIPMo’s technical and functional components offer you all the essential features for a comprehensive professional monitoring system. It meets the needs of the most demanding Information System Departments (ISD) / Data-Center (DC) while providing the flexibility linking.
The SIPMon for IP contact center & IT solution, monitors contact center services and underlying infrastructure components in contact centers in accordance with end-user’s service level agreements. Components monitored include Call Manager, Gateways and Gatekeepers, IP and ATA Phones, Routers and Switches, Servers, Firewalls, and more. All VoIP status data is analyzed and displayed in graphical alarm dashboards, performance reports, and SLA compliance reports.
Today’s successful contact center deployments require incessant network availability and 360 degree transparency of the infrastructure.
To achieve this requirement, it is crucial to proactively monitor end-to-end performance of all contact center & IT components for improved quality of service and problem diagnosis.
The SIPMon for Contact Center & IT solution. provides full VoIP & IT network infrastructure monitoring with emphasis on continuous SLA compliance and end-user satisfaction.
Features
Real time system monitoring
» Outage detection
» Availability detection
» Fine-grained thresholds definitions for alerts
» Active (pull) queries
» Passive (push) queries
» SNMP trap receipts
» Hosts group metrics compositing
» Services group metrics compositing
» Aggregate reporting
» SLA metrics aggregation (Meta service)
» Downtimes scheduling
» Issue acknowledgments mechanisms
» Comments recording
» Search filters for log interrogations
» Configurable frequencies for KPI collection
Load Balancing / High availability
» Load analysis breakdowns as per:
• Strategy (security);
• Geography (WAN);
• Network topology.
» Fail-over satellite server configuration
» Pre-production satellite server configuration
» High availability configuration using:
• Replicated MySQL databases;
• Web interfaces;
• Monitoring engines;
• Graphs/reports.
Flexible Configuration
» SNMP V1,V2 & V3 compatibility
» Configuration template management
» Hosts and services template interaction
» Application template library management
» N-level template inheritance
» Automatic SNMP traps collection and management
» Customized macro
» Network topology management
» Atomic KPI configuration
Dashboards
» Daily statistics of status durations
» Single server online reporting
» Hosts online reporting
» Service group online reporting
» Configurable update frequencies
» CSV report export
» Interactive timeline for report monitoring
User Access Controls
» Access group definitions
» Interface access restrictions
» Hosts group resource view restrictions
» Service groups resource view restrictions
» Service category resource view restrictions
» LDAP Authentication
» User action logs
Hierarchical Notification System
» Business dependencies
» Network dependencies
» Notification via mail, SMS or other systems
Hierarchical escalation configuration
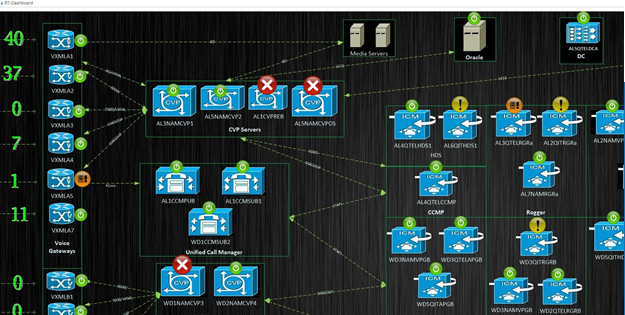
Main Window
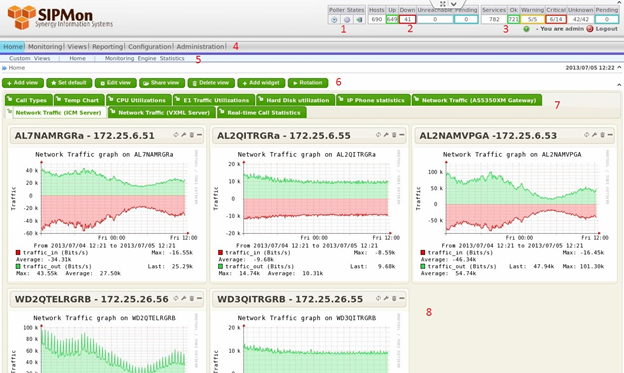
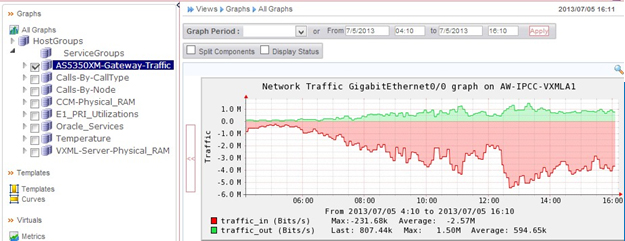
Some of the Graphs
Global Health
This page is available via the menu:
Home -> Home -> Global Health
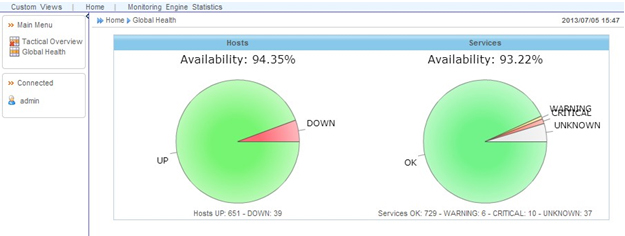
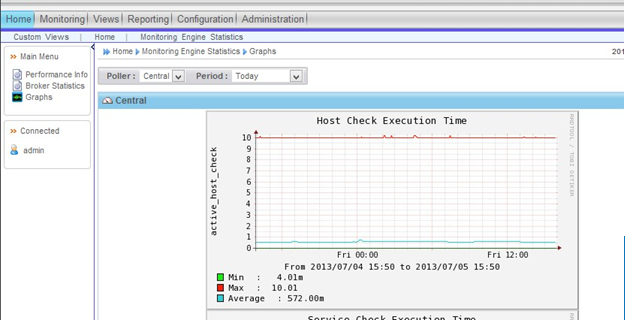
Home -> Monitoring Engine Statistics -> Graphs
Services
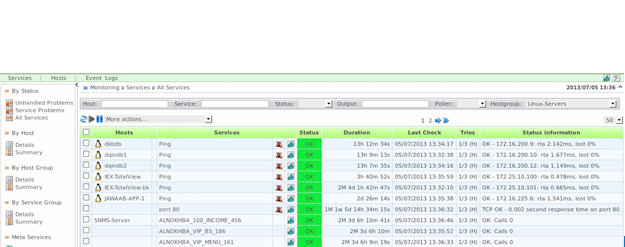
• The service pages give real-time information concerning the status and the states of the checkpoints according to a refreshing frequency programmed in the general options.
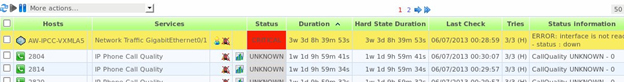
Monitoring -> Services -> Service Problems
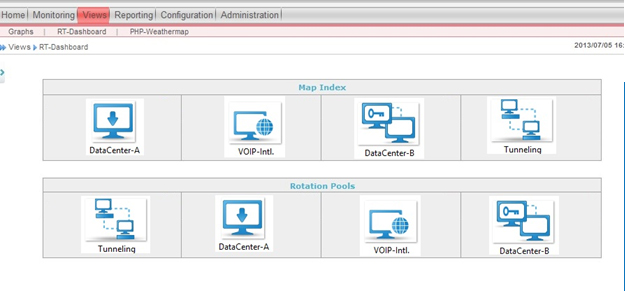
Real-time Dashboard